Let’s take a minute to discuss Auction Market Theory and our approach utilizing a Top – Down – Bottom – Up systematic process . We discuss this often, but do we really understand what it entails? The Market is made up of fractals. Let’s think of this as symmetry . Forever evolving. Forever expanding. We sometimes refer to these fractals as Matryoshka Dolls – an analogy utilized to describe the very nature of a fractal. Matryoshka Dolls are a representation of a family lineage beginning with the mother carrying her child who then goes on to have a child of her own – a nd so on and so on down the family line. The biggest doll all the way to the smallest doll. The se fractals have the same hierarchical structure in the financial markets which we chose to observe or engage ourselves in. This emerges in the form of what we call Volume Profile. The behavior we observe from the auction participants tell the rest of the story depending on what fractal they decide to operate in.
What are these fractals?
Starting with our Biggest fractal we have our Composite Volume Profile .

You can see in the above picture how the volume distributions take on these bell curve – like shapes with most of the volume in the middle and the least amount of volume on the edges of the distribution. Sometimes these can be very clean and other times very rough – or “toothy” – is how they are often referred to as . Regardless of shape – the story these distributions tell us is where price has been most accepted (HVN) and where price has been least accepted (LVN) .
The market goes up to go down – and goes down to go up. During this endless search to seek fair value, it does so by interacting with the low and high – volume areas. The high – volume areas act as sort of a magnet – so to say , and it does this due to a larger amount of acceptance at one point in time – hence the higher volume. The low volume areas are generally observed as pivot al areas where the auction will check it – and then decide to seek the higher volume node above it or below it.
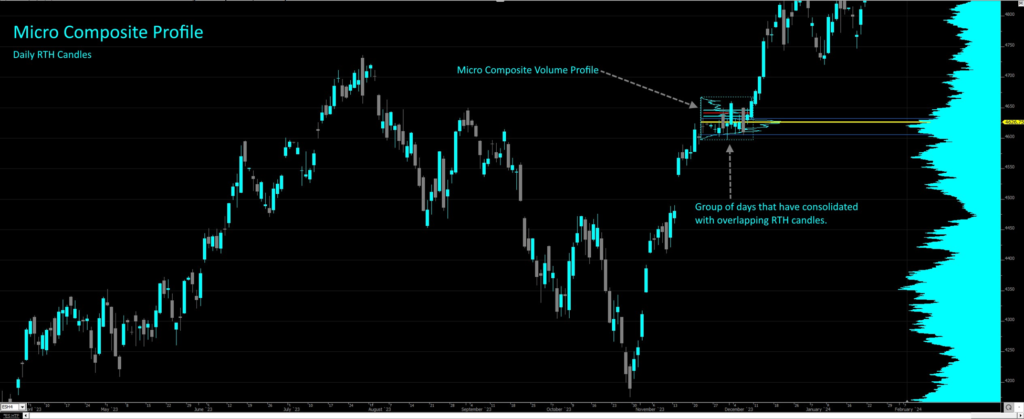
Moving to the next fractal down we have our Micro - Composite Volume Profile .
At the Micro – Composite level , we are going to observe the same behavior of these “checks and balances” in the market in the form of these low and high – volume nodes. Since we are zooming in to the market, we are going to need a new lens. We can compare this to our analogy above using the Matryoshka Dolls . The smaller they get, the more focus we need to observe the detail. Maybe this one we just need to squint some – but as we get to the smaller dolls (fractals) we might need to use a magnifying glass to appreciate the detail – otherwise, we ’re just look ing at noise and can’t appreciate the smaller detail .
The Micro – Composite Volume Profile takes our Composite view and isolates the RTH days that have consolidated. In other words, there is overlap of the candles and this tells us that the auction has some sort of temporary acceptance in this general area. Let’s explore.
This is 1 Micro – Composite Volume profile that we have isolated to reduce the noise

Lets go ahead and apply multiple Micro – Composite Volume Profiles and add some noise.

We can all probably agree there is a lot going on. Tha t is fine since our focus is to look within these Micro Composite Profiles .
Lets take a look at what we are actually interested in.

The same behavior is observed here that we saw in the bigger Composite fractal that we explored earlier. A series of auction mechanics testing low volume area’s and gravitating to higher volume areas. Similarly, we can see distributions forming creating that bell curve like profile – whilst other areas have the “toothy” profile.
What does this all mean? Anticipation .
As we approach these areas of high and low volume in the Micro Composite Volume Profile we can anticipate a reaction . This behavior is anticipated because it is aligned with the mechanics of an auction. Hence, Auction Market Theory. We must anticipate to participate as long as it is in line with our system that has vetted metrics behind it. Otherwise, we can observe and narrate the behavior.
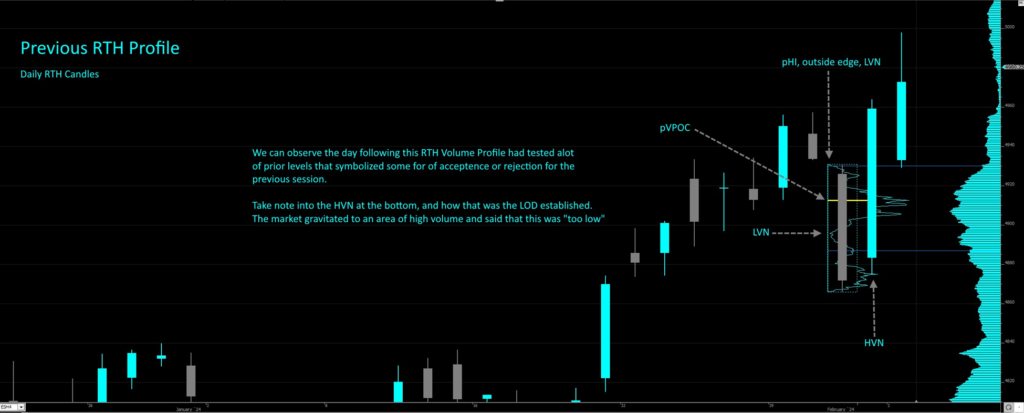
Moving to the next size fractal down we can look at the Previous D ay RTH .
This is often referred to as “ p ” to indicate previous . p HI , p LO , p VPOC , etc.
We can see the same components of the volume profile as examined in the two prior fractals

As we continue to look at smaller fractals. We continue to observe the same market behavior . These are our dolls. These are our fractals
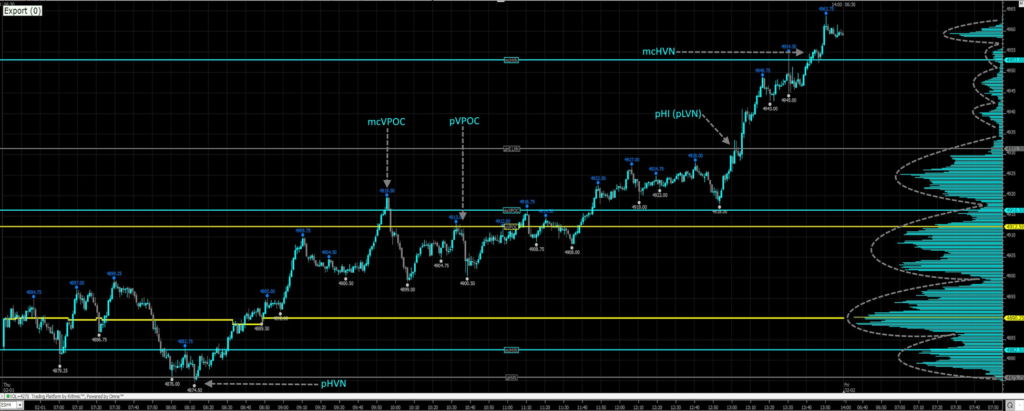
Moving to the next size fractal down we can look at the Developing RTH Fractal .
This fractal is unique to most “day traders” as this is where we watch the current day auction unfold. Again , the behaviors we observe are the same as we create certain volume distributions every day with areas of high volume and areas of low volume .

Let’s bring this all together. As we have gone from our larger fractals down to our smaller fractal s we observe the same behavior – but looking at it through a different lens each time. The financial markets are active worldwide and we have participants engaging with many different approaches.
We have larger participants with more influence that only operate on a composite level – they don’t worry about the day to day, or potentially even the week to week. Since they operate on a higher time frame this typically comes with more weight on their positions . Their behavior is anticipated around these larger consolidations where we observe composite high and low volume nodes.
There are other participants who operate within the monthly fractal – or even the Micro – Composite Fractals . They’re highly influential in the market but using the same analogy above regarding weight – they operate with less weight than the long term – composite participants.
Let’s zoom into the RTH . Less weight – but same behaviors. This is usually retail traders . If we look at this from a retail lens and who we are up against and trading against it is imperative to understand that we are up against the bigger fish so to speak. People who can influence the market and make it very responsive .
But we do have ways to navigate these waters. Stay with me.
In the developing RTH picture above we can observe the day making a initial LOD at a mcHVN which is the bottom blue line. Price reacts there and goes on to make a higher high. We come back down and test that mcHVN again and the “ Matryoshka Doll ” opens up to allow us test a smaller fractal which was the Previous RTH HVN . Th e market said, “too low” and thi s was indeed our LOD.
As we come up and start creating new highs, we have areas of interest above us as targets. A pVPOC and a mcVPOC above it. It is important to understand we should respect each fractal target as we never know if the market will take us to the next pit stop. pVPOC is a smaller fractal/doll then the mcVPOC . The mcVPOC carries more weight. You can see that we pushed through the pVPOC and picked the mcVPOC and as anticipated – we rejected that area and had a counter rotation.
This is where its important to pay attention . Since the developing RTH rejected the mcVPOC initially th e market heads back up to test the waters . Since mcVPOC was “too high”. Our next logical area and fractal size down would be to test the pVPOC . You can see it does this and we also get an anticipated reaction.
We eventually are able to break through both of those levels to explore higher in the auction. But it is important to understand that these behaviors are checks and balances in the market that are participant driven on all times frames and fractals. We must be mindful of the “weight” these fractals carry with them. If we are long a position and we have a pVPOC 20 points away but there is a mcVPOC 10 points away. This is an obstacle with HEAVIER weight
